

The Educational Opportunity Project at Stanford has created an interactive tool by which we can trace economic and racial segregation in schools. As readers of this site would predict, racially segregated schools are likely also to be economically segregated.
You can toggle for a quick big-picture overview by state and district. On the screen shot heading this post, darker green states have higher numbers of children attending schools with high concentrations of free-lunch eligible* students; the darker dots represent schools and districts with high concentrations of free-lunch eligible students in some buildings. The map allows you to search for and view metropolitan areas, regions, counties, school districts, schools, and neighborhoods. You can also see data on segregation trends from 1991-2020. You can explore intersections of racial and economic segregation and track trends in each over time.
In my home town in Wisconsin, nearly 1/3 of all students are free-lunch eligible, though economic segregation in schools has dropped slightly since 1991, perhaps because the district has been closing and consolidating schools.
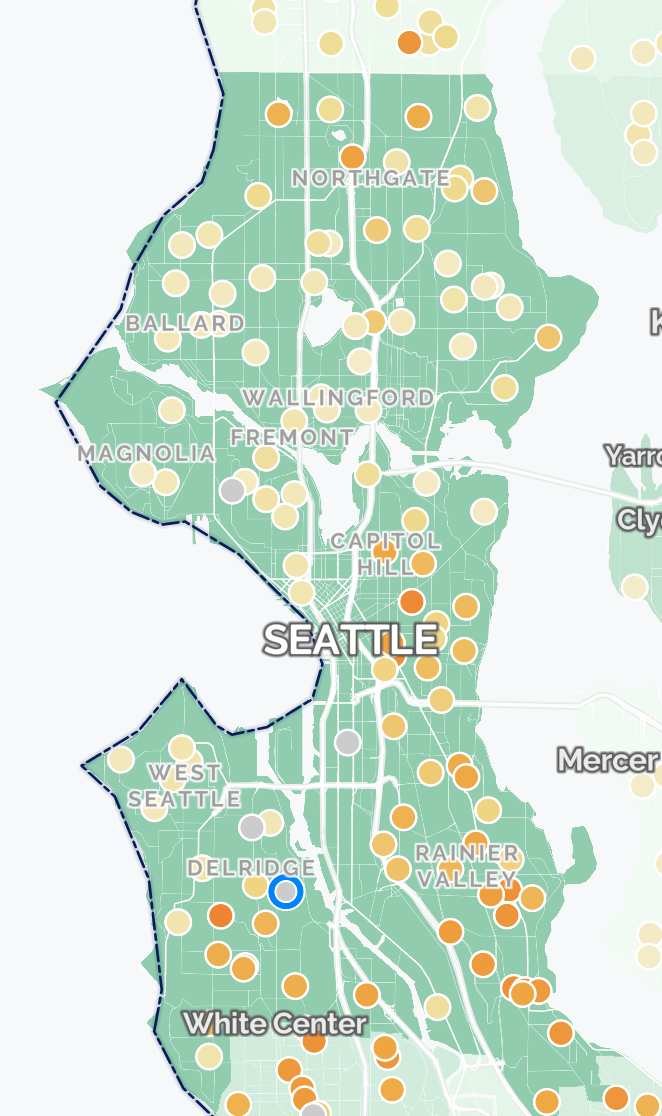
In Seattle, where I now live, 26% of students are free-lunch eligible and the district has become modestly more economically segregated over the decade, perhaps because of rising housing costs in some neighborhoods, the high numbers of families who send their children to private schools, or the savviness of privileged parents in navigating the options for transferring out of neighborhood schools.
The Seattle map clearly shows the concentration of schools where fewer than 10% of students are free-lunch eligible (light dots) and others where more than 60% of students are from lower-income families (the darker dots).
Why does it matter? Students in schools with higher concentrations of poverty are likely to have less-experienced teachers who may also be teaching outside of their areas of expertise. They're likely to have fewer AP classes, and in the cafeteria, there are fewer conversations about the range of possible paths that young people might take after graduation. Buildings are likely to be older. Parents are much less likely to be able to privately supplement funding when district and state budgets fall short, so there may be fewer counselors, teachers, field trips, enrichment activities or working computers.
Sean Reardon, the director of the project describes the intent of the tracker:
“The American Dream will remain out of reach until all of our children have equal educational opportunities. My hope is that this data will help in the hard work of bringing the dream closer to reality.”
Data alone does not, of course, drive political decisions, and affordable housing policies and school assignment policies are highly political. And as always, I think that the politics of these issues would be more equitable if many more college students learned about how segregated public schools in the United States are, even as we tout schools as the great levelers of opportunity.
*Children from families at or below 130% of the federal poverty level are eligible for free school lunches.


