

If I were in charge, I'd have a session during first-year orientation in which I challenged all the students to ponder this graph of parental investment expenditures per child by income level:
In that orientation session at the very start of college, I'd ask students to reflect upon what it means the gaps in family spending on children's childcare, education, and organized activities have grown significantly between families in the highest income brackets and families at most other income levels.
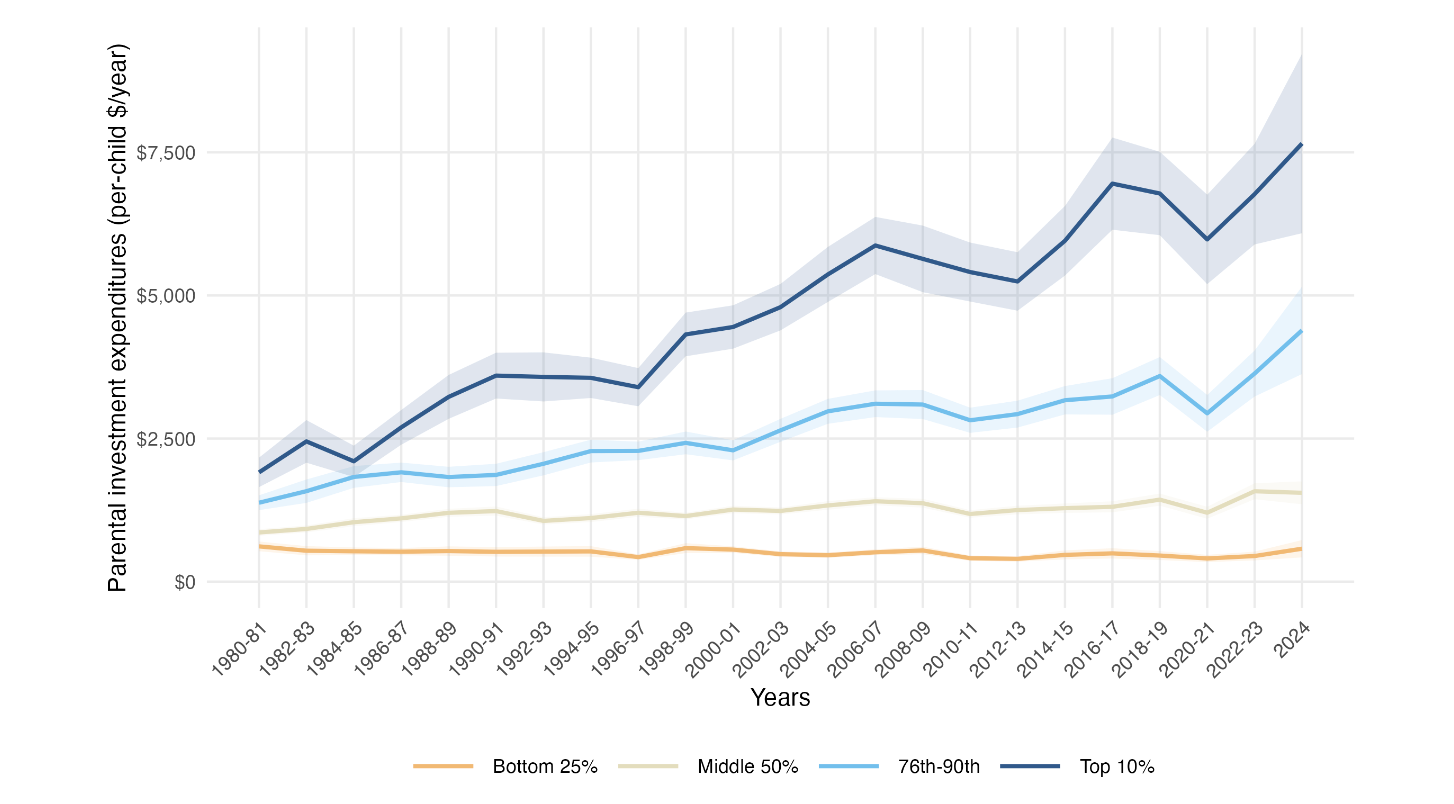
The graph is from Orestes Hastings's new working paper "More Unequal Childhoods: 45 Years of Widening Income Gaps in Parental Investments in the United States". Using data from the 1980-2024 Consumer Expenditure Survey, Hastings documents that over those 45 years,
Per-child spending in the top decile nearly quadrupled in real terms, while bottom-quartile spending was slightly lower in 2024 than in 1980. Thus, the top decile spent roughly three times as much per child as the bottom quartile in the early 1980s but more than thirteen times as much by 2024.
I'd gently ask the first-year students to consider what this research means in how they'll understand themselves as members of this new community of students.
Elsewhere, they will learn about the diversity in religious beliefs, in political stances, in gender orientation, in race and ethnicities, in disabilities and the myriad other ways that peers will enrich their understanding of the world.
It seems important for them to also learn that some people in the room have benefitted from so much parental investment in their competitive advantages while others parents have been able to provide much less.
These seem to be important conversations at the start of college because as is the case with every dimension of difference, they are questions about who has the power to judge and who will be judged. They're questions about responsibility for learning about the circumstances of others' lives, about responsibility for your own actions, about who we'll all become as citizens.
They are questions about the assumptions students may have made about "deserving" and "undeserving".
They are questions about the very meaning of being educated about the circumstances of our own lives. And they are conversations too rarely had on campuses.
I would be clear that privileged guilt was the very last thing that I intended in showing this graph. This chart is about parent choices and parent capacity, not anything that first-year students have done.
I would be even more clear that less privileged students should feel no shame when these difference in personal resources become evident in the dailiness of campus life.
My strong belief is that discovering these gaps shouldn't be casual or accidental for poor and working-class students, as they so often now are. Students shouldn't be left alone to learn that a lot of them have entered a race long after others left the gate, especially since they'd been promised for years that education is the great equalizer.
When looking at this chart, I might also ask what these parents fear when spending this much more on own children than parents were spending a short time ago, and why those fears have become the problem of others in their children's first-year class. I'd ask why the norm on campuses is to protect those privileged students by rarely talking about increasingly unequal childhoods, even when that means that other students blame themselves for not measuring up. I may not ask those particular questions out loud at orientation, but those questions are an entry point to analyses of the broader contexts of social and educational inequality and zero-sum beliefs about opportunity.
I'd hope that privileged students might leave that session a bit more humble about what they may understand as their relative innate merit. I'd hope that poor and working-class students might leave the session more willing to name unearned privilege and to speak up when they're being judged for the artifacts of structural inequalities that benefit those who hold the power to judge.
Mostly, I'd hope that after that first orientation session, all students would ask their professors and staff a lot more about all of this in their classes, because currently, there's so little talk about social class and economic inequalities within the student body (and within the faculty). I'd hope that students from poor and working-class backgrounds would question why first-gen support programs instead downplay differences between themselves and their peers.
Perhaps, planning that kind of an orientation session is part of why I've never, ever been put in charge.
But I can still dream.
For reference, the upper limits of household quintiles (a slightly different measure than the quartiles and deciles used in this paper but the data indicate how many households are living on relatively low incomes):
In 2024, households in the lowest quintile had incomes of $34,510 or less. Households in the second quintile had incomes as high as $65,100, those in the third quintile had incomes as high as $105,500, and those in the fourth quintile had incomes as high as $175,700. Households in the highest quintile had incomes higher than $175,700. The top 5 percent of households in the income distribution had incomes of $335,700 or higher.
It's my experience that students raised within relatively higher incomes assume that they're relatively poor because they're aware of the very wealthy, and that it's very educational for them to learn how so many families raise children with much less.


